python 分析世界高收入数据集
2020-12-26 16:31
标签:title show gre 中文字符 图像 ide 不同 atp sys 1、加载库 2、读取数据 2180行, 354列 3、美国每年的平均收入 4、分析不同群组的美国高收入数据 前 10% 收入份额,前 5% 收入份额,前 1% 收入份额,前 0.5% 收入份,前 0.1% 收入份额 5、分析不同群组的美国高收入数据进行均值归一化,查看其变化趋势 6、美国的高收群体不同组的资本收益数据 7、进一步分析美国高收入群体中不同组的平均收入随时间的相对变动 8、美国最富裕群体的收入组成 python 分析世界高收入数据集 标签:title show gre 中文字符 图像 ide 不同 atp sys 原文地址:https://www.cnblogs.com/shanger/p/13034577.htmlimport os, sys, re
import numpy as np
import pandas as pd
import matplotlib.pyplot as plt
path = r‘E:\数据集‘
data_file = os.path.join(path, "income_dist.csv")
df = pd.read_csv(open(data_file))  # 路径含有中文字符,用 open() 函数
df.info()

# 筛选行,设置年份为索引
df_i = df[df.Country == ‘United States‘].set_index(‘Year‘)

# 筛选列
data = data_1.loc[:, [‘Country‘, ‘Average income per tax unit‘]]
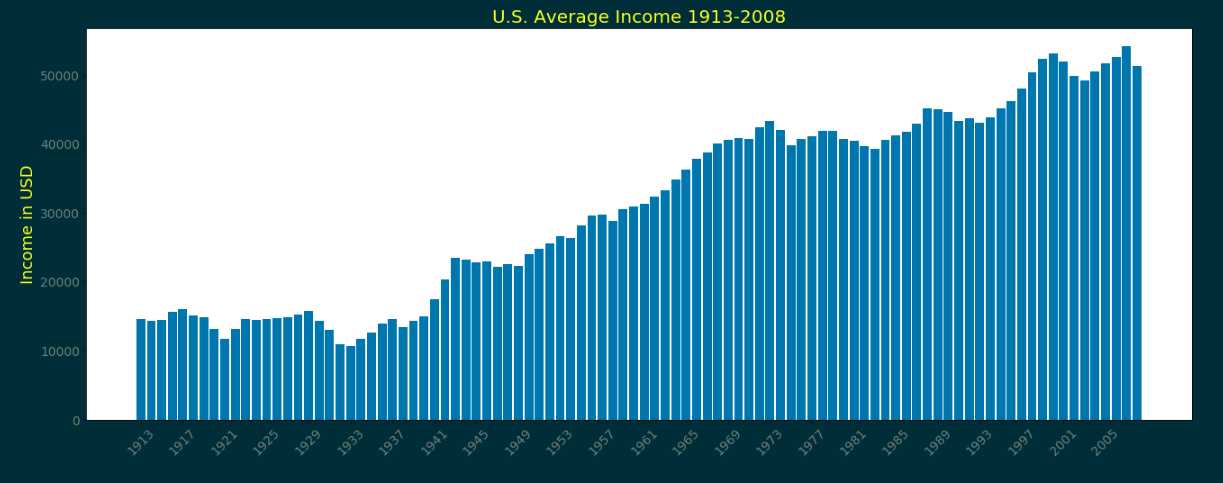
ind = np.arange(len(data))  # 标识柱体的横轴位置的迭代器

# 以面向对象风格的接口绘图
fig = plt.figure(figsize=(22, 8))  # 初始化画布, 创建基准图表
ax = plt.subplot(111)  # 一行一列的绘图方格的坐标轴数组

ax.bar(ind, data.iloc[:, 1], width=0.85)  # 用‘ Average income per tax unit‘ 绘制柱状图,每个柱体宽度为 0.35
ax.set_xticks(np.arange(0, len(data), 4))  # 横轴刻度间隔为 4
ax.set_xticklabels(data.index[0::4],
                   fontdict={‘size‘: 14, ‘color‘: ‘grey‘},
                   rotation=45)  # 横轴刻度标签为间隔为 4 的年份,旋转 45 度
ax.set_ylabel(‘Income in USD‘,
              fontdict={‘size‘: 18, ‘color‘: ‘yellow‘})  # 纵轴标签
plt.title(‘U.S. Average Income 1913-2008‘,
          fontdict={‘size‘: 20, ‘color‘: ‘yellow‘})  # 设置图像标题

plt.yticks(size=14, color=‘grey‘)
plt.show()
# 用正则筛选预期的列名成
i = df.columns.str.contains(‘Top (10|5|1|0.5|0.1)%.+share$‘, regex=True)
columns = df.columns[i].tolist()

df_i = df[df[‘Country‘]==‘United States‘].set_index(‘Year‘)   # 筛选行, 设置年份为索引
df_ij = df_i[columns] # 筛选列,

fig = plt.figure(figsize=(12, 8))

for col in df_ij:
    lab = re.search(r‘Top .+%‘, col).group()
    df_ij[col].dropna().plot(label=lab)

plt.yticks(fontproperties=‘Times New Roman‘, size=18, color=‘grey‘)
plt.xticks(fontproperties=‘Times New Roman‘, size=18, color=‘grey‘)
plt.legend(loc=‘best‘, fontsize=15)
plt.xlim(1900, 2020)
plt.ylim(0, 50)
plt.xlabel(‘year‘, size=18, color=‘yellow‘)
plt.show()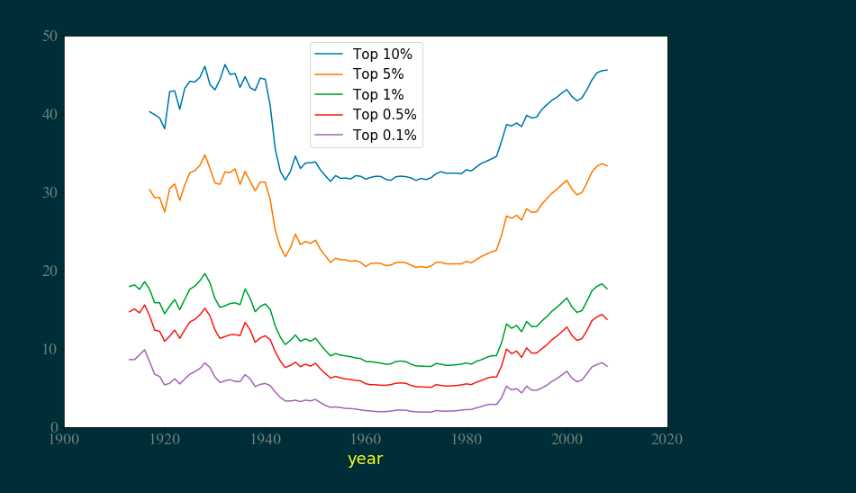
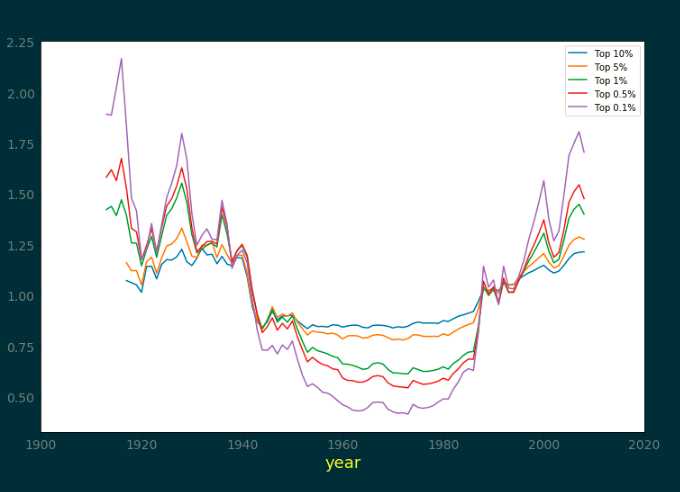
# 用正则筛选预期的列名成
i = df.columns.str.contains(‘Top (10|5|1|0.5|0.1)%.+share$‘, regex=True)
columns = df.columns[i].tolist()

df_i = df[df[‘Country‘]==‘United States‘].set_index(‘Year‘)   # 筛选行, 设置年份为索引
df_ij = df_i[columns] # 筛选列,

fig = plt.figure(figsize=(12, 8))

for col in df_ij:
    lab = re.search(r‘Top .+%‘, col).group()
    mean = df_ij[col].mean()  # 列均值
    norm = df_ij[col] / mean  # 均值归一化
    norm.dropna().plot(label=lab)  # 归一化后的的非空值绘图

plt.yticks(size=14, color=‘grey‘)
plt.xticks(size=14, color=‘grey‘)
plt.xlabel(‘year‘, size=18, color=‘yellow‘)
plt.xlim(1900, 2020)
plt.legend()
plt.show()
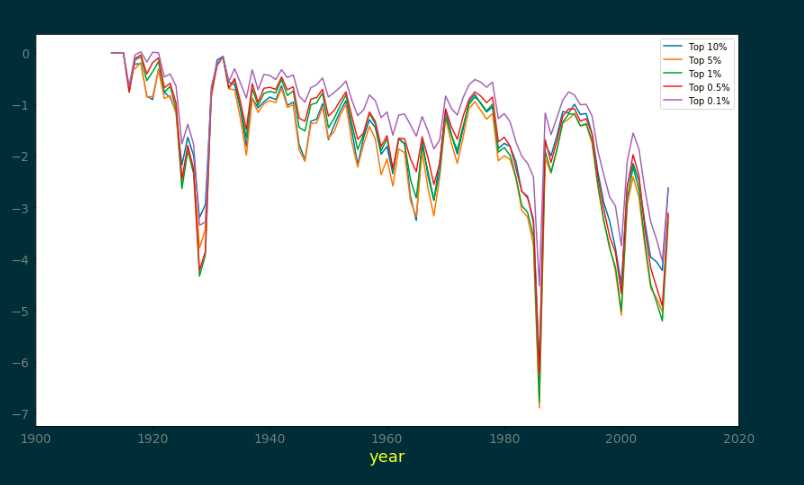
# 选取包含资本收益和不包含资本收益的收入组
i_1 = df.columns.str.contains(‘Top (10|5|1|0.5|0.1)%.+share$‘, regex=True)
i_2 = df.columns.str.contains(‘Top (10|5|1|0.5|0.1)% in.+capital gains$‘, regex=True)
cols = zip(df.columns[i_1], df.columns[i_2])
cols = list(cols)

# 筛选行, 设置年份为索引
df_i = df[df[‘Country‘]==‘United States‘].set_index(‘Year‘)

fig = plt.figure(figsize=(14, 8))

# 资本收益 = 包含资本收益的收入 - 不包含资本收益的收入
for col_a, col_b in cols:  # cols 是二元元组的列表
    lab = re.search(r‘Top .+%‘, col_a).group()
    capital_gains = df_i[col_a] - df_i[col_b]
    capital_gains.dropna().plot(label=lab)

# 设置图形参数
plt.yticks(size=14, color=‘grey‘)
plt.xticks(size=14, color=‘grey‘)
plt.xlabel(‘year‘, size=18, color=‘yellow‘)
plt.xlim(1900, 2020)
plt.legend()
plt.show()
# 筛选行, 设置年份为索引
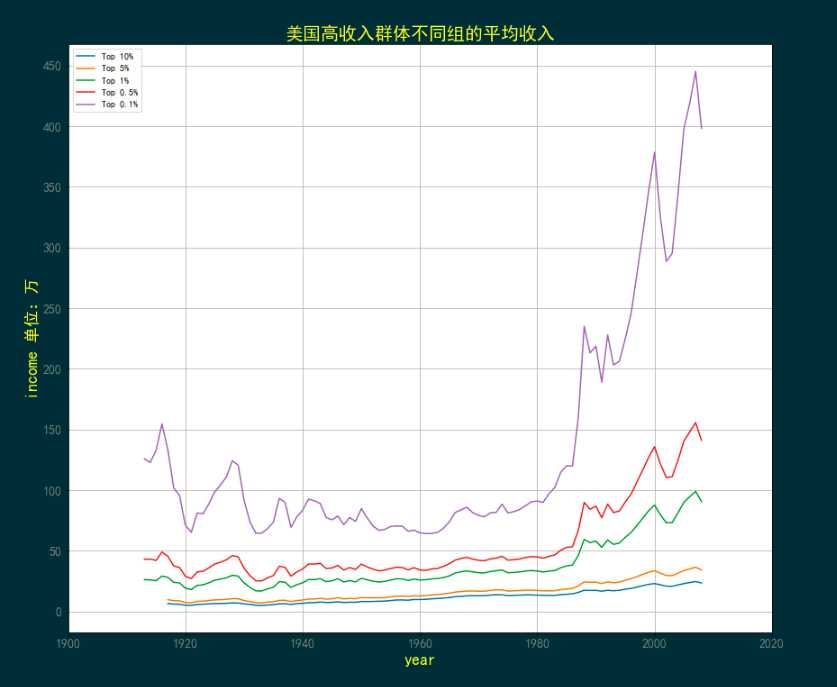
df_i = df[df[‘Country‘]==‘United States‘].set_index(‘Year‘)

i = df_i.columns.str.contains(‘Top (10|5|1|0.5|0.1)% av.+income$‘)
cols = df_i.columns[i].tolist()
df_ij = df_i[columns]

plt.rcParams[‘font.sans-serif‘] = ‘SimHei‘  #  使轴标题正常显示中文
fig = plt.figure(figsize=(14, 12))

# 资本收益 = 包含资本收益的收入 - 不包含资本收益的收入
for col in cols:
    lab = re.search(r‘Top .+%‘, col).group()
    df_ij[col].dropna().plot(label=lab)

plt.yticks(range(0, 5000000, 500000),
           range(0, 500, 50),
           size=14, color=‘grey‘)

plt.ylabel(‘income 单位:万‘, size=18, color=‘yellow‘)
plt.xticks(size=14, color=‘grey‘)
plt.xlabel(‘year‘, size=18, color=‘yellow‘)
plt.title(‘美国高收入群体不同组的平均收入‘, size=20, color=‘yellow‘)
plt.xlim(1900, 2020)
plt.legend()
plt.grid()
plt.show()
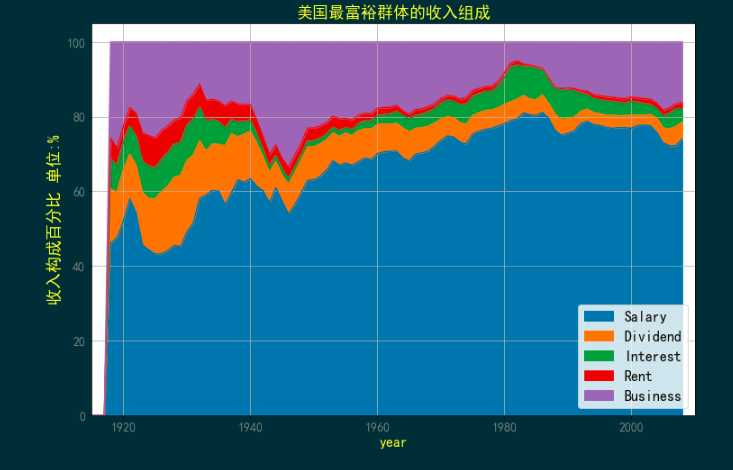
%matplotlib inline
# 筛选行, 设置年份为索引
df_i = df[df[‘Country‘]==‘United States‘].set_index(‘Year‘)

# 选择期望的列名称
i = df.columns.str.contains(‘Top 10% income com.+?-[WDIRE]‘)
cols = df.columns[i].tolist()
cols.pop(3)  # Investment income 不需要

df_ij = df_i[cols] # 对筛选过行的数据框进行列筛选

# 图例标签
labs = [‘Salary‘, ‘Dividend‘, ‘Interest‘, ‘Rent‘, ‘Business‘]

fig = plt.figure(figsize=(12, 8))
ax = plt.gca()

# 为了转换图例标签进行的数据框重命名
df_ = df_ij.rename(dict(zip(cols, labs)), axis=1)

df_.plot(kind=‘area‘, ax=ax)
plt.yticks(size=14, color=‘grey‘)
plt.ylabel(‘收入构成百分比 单位:%‘, size=18, color=‘yellow‘)
plt.xticks(size=14, color=‘grey‘)
plt.xlabel(‘year‘, size=16, color=‘yellow‘)
plt.xlim(1915, 2010)
plt.legend(loc=‘best‘, fontsize=16)
plt.title(‘美国最富裕群体的收入组成‘, size=18, color=‘yellow‘)
plt.grid()
plt.show()
