机器学习之线性回归算法
2021-02-09 07:16
阅读:558
1.本节重点知识点用自己的话总结出来,可以配上图片,以及说明该知识点的重要性
(1)、回归算法总结:
回归是统计学中最有力的工具之一。机器习监督学习算法分为分类算法和回归算法两种,其实就是根据类别标签分布类型为离散型、连续性而定义的。回归算法用于连续型分布预测,针对的是数值型的样本,使用回归,可以在给定输入的时候预测出一个数值,这是对分类方法的提升,因为这样可以预测连续型数据而不仅仅是离散的类别标签。
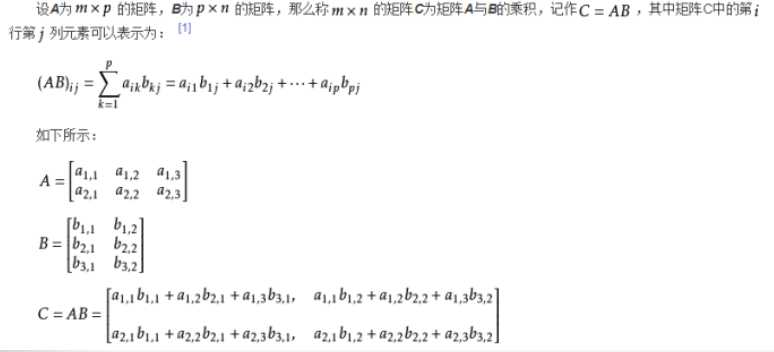
(2)、矩阵的运算:

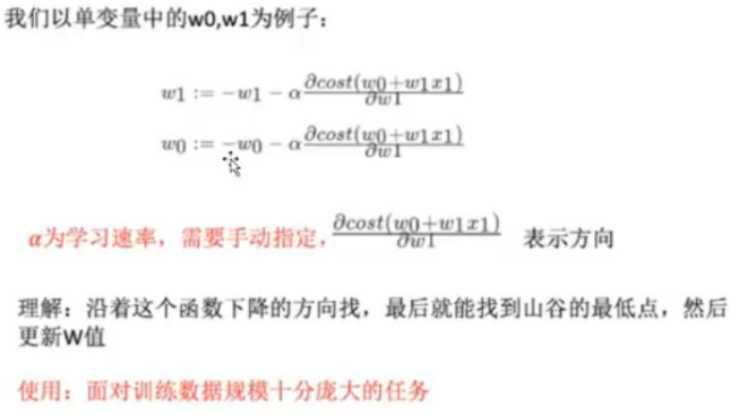
(3)、最小二乘法:

2.思考线性回归算法可以用来做什么?
线性回归的预测模型虽然是一元(线性)方程,但现实中很多应用场景符合这个模型,例如商品的价格与商品的销量之间的关系。一般来说价格越贵则销量越低,价格越便宜则销量越高,于是我们就能够用
“销量=a*价格+b”这个模型来最大化商家的收益。
3.自主编写线性回归算法。
import math
import numpy as np
import matplotlib.pyplot as plt

from sklearn.preprocessing import PolynomialFeatures  # 多项式拟合
from sklearn.linear_model import LinearRegression
from sklearn.pipeline import Pipeline   #创建流水线
from sklearn.metrics import mean_squared_error  #计算误差


# 创建拟合模型
def polynomial_model(degree=2):
    # 这是一个流水线,先增加多项式阶数,然后再用线性回归算法来拟合数据
    return Pipeline([("polynomial_features", PolynomialFeatures(degree=degree, include_bias=False)),
                     ("linear_regression", LinearRegression(normalize=True))])


if __name__ == ‘__main__‘:
    print(‘\033[5;31;2m%s\033[0m‘ % ‘1、线性回归算法的应用‘)
    print("(1)首先,生成200个在[-2∏, 2∏]区间内的正弦函数上的点,并且给这些点加上一些随机的噪声。")
    pi = math.pi
    x = np.linspace(-2 * pi, 2 * pi, 200)
    y = np.sin(x) + 0.2 * np.random.rand(200) - 0.1
    x = x.reshape(-1, 1)
    y = y.reshape(-1, 1)
    # 显示点的效果
    # plt.scatter(x, y)
    # plt.show()
    print("生成数据完成")

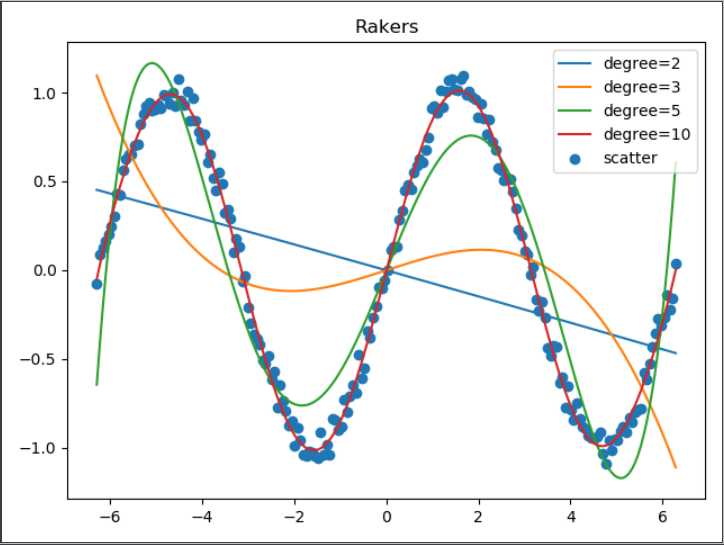
    print("(2)接着,使用PolynomialFeatures和Pipeline创建一个多项式拟合模型,分别用2、3、5、10阶多项式来拟合数据集。")
    models = []
    for d in [2, 3, 5, 10]:
        model = polynomial_model(degree=d)
        model.fit(x, y)
        models.append({‘model‘: model, ‘degree‘: d})
    print("创建完成")

    print("(3)算出每个模型拟合的评分,然后使用mean_squared_error算出均主根误差,即实际点和模型预测的点之间的距离,均主根误差越小说明模型拟合效果 真好 。")
    for model in models:
        degree = model[‘degree‘]
        model = model[‘model‘]
        score = model.score(x, y)
        mse = mean_squared_error(y, model.predict(x))
        print("degree = %d, score=%f, mse=%f" % (degree, score, mse))

    print("(4)最后,请把不同模型的拟合效果在二维坐标上画出来,从而可以清楚对比不同除数的多项式的拟合效果。")
    plt.scatter(x, y)
    legends = []
    for model in models:
        degree = model[‘degree‘]
        model = model[‘model‘]
        legends.append(‘degree=‘+str(degree))
        plt.plot(x, model.predict(x))
    legends.append(‘scatter‘)
    plt.legend(legends)
    plt.title("Rakers")
    plt.show()


评论
亲,登录后才可以留言!