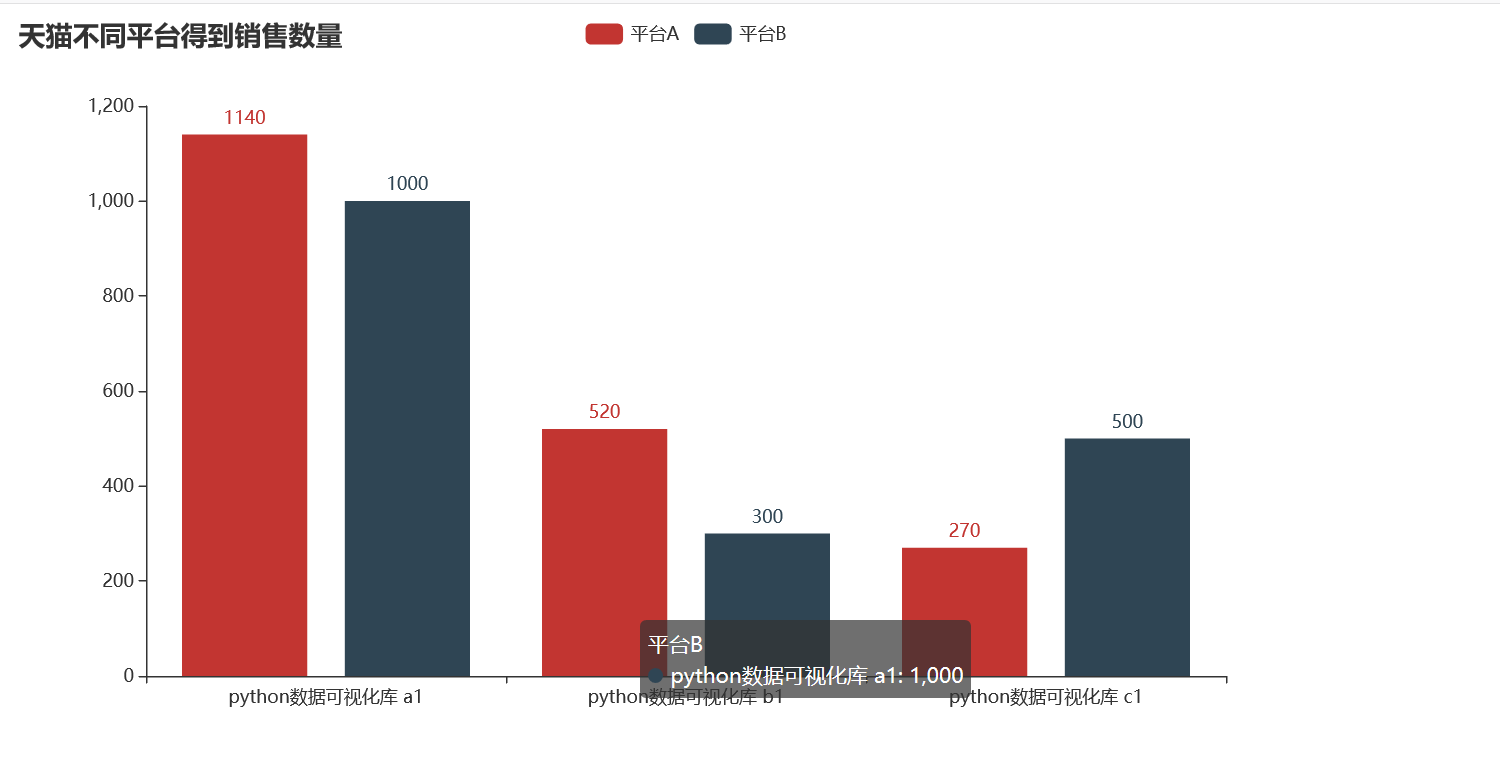
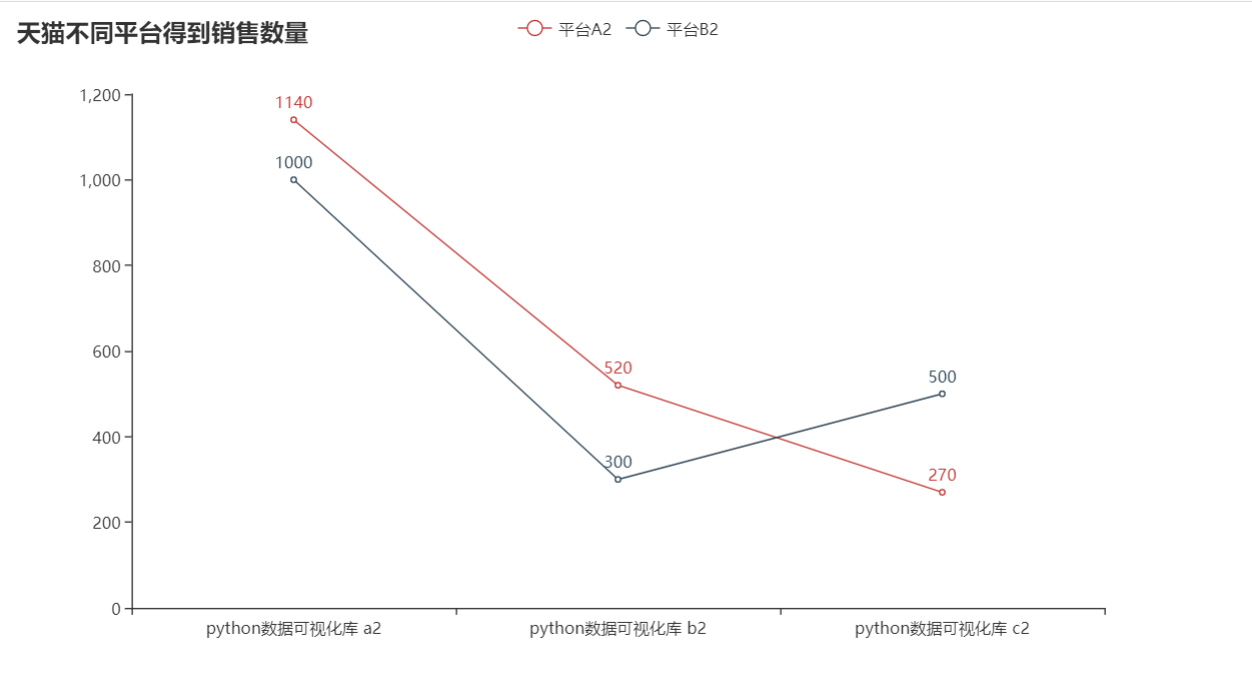
6,python3 pyecharts生成Html文件柱状图 和 Html文件折线图
2021-03-27 09:26
标签:too port 折线图 render html 线图 python3 add 图表 6,python3 pyecharts生成Html文件柱状图 和 Html文件折线图 标签:too port 折线图 render html 线图 python3 add 图表 原文地址:https://www.cnblogs.com/k8s-pod/p/13662419.htmlpip3 install pyechatrs
#! /usr/bin/python3
from pyecharts.charts import Bar, Page
from pyecharts import options as opts
x = [ ‘python数据可视化库 a1‘,‘python数据可视化库 b1‘,‘python数据可视化库 c1‘ ]
y1 = [ 1140,520,270 ]
y2 = [1000,300,500]
bar = Bar()
#设置x轴
bar.add_xaxis(xaxis_data=x)
#设置y轴
bar.add_yaxis(series_name=‘平台A‘,y_axis=y1)
bar.add_yaxis(series_name=‘平台B‘,y_axis=y2)
bar.set_global_opts(title_opts=opts.TitleOpts(title=‘天猫不同平台得到销售数量‘))
#生成html文件
bar.render(path=‘first_bar.html‘)

#! /usr/bin/python3
from pyecharts.charts import Bar, Page, Line
from pyecharts import options as opts

x = [ ‘python数据可视化库 a2‘,‘python数据可视化库 b2‘,‘python数据可视化库 c2‘ ]
y1 = [ 1140,520,270 ]
y2 = [1000,300,500]

def line_charts():
	c = Line()
	#设置x轴
	c.add_xaxis(xaxis_data=x)
	#设置y轴
	c.add_yaxis(series_name=‘平台A2‘,y_axis=y1)
	c.add_yaxis(series_name=‘平台B2‘,y_axis=y2)
	#数据项设置
	c.set_global_opts(
			title_opts=opts.TitleOpts(title=‘天猫不同平台得到销售数量‘),
			legend_opts=opts.LegendOpts(is_show=True),
			tooltip_opts=opts.TooltipOpts(trigger=‘axis‘,axis_pointer_type=‘cross‘)
	)
	return c

#绘制图表
c = line_charts()
c.render(path=‘line.html‘)

下一篇:python-文件读写操作
文章标题:6,python3 pyecharts生成Html文件柱状图 和 Html文件折线图
文章链接:http://soscw.com/essay/68516.html