ArcGIS API for js InfoWindow
2021-06-18 07:06
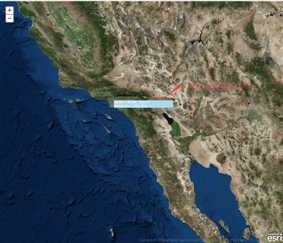
标签:scala col href color ima actions ane app doc 说明:有关该示例中怎么引用部署在iis上的离线arcgis api请参考我前面的博文 1、运行效果 2、HTML代码 其中的代码 map = new esri.Map("map", { center: [-116.96, 33.184], zoom: 4 }); MyTiledMapServiceLayer = new esri.layers.ArcGISTiledMapServiceLayer ("http://localhost/arcgis/rest/services/DZDT2012/MapServer"); ArcGIS API for js InfoWindow 标签:scala col href color ima actions ane app doc 原文地址:https://www.cnblogs.com/net064/p/10309239.html
DOCTYPE html>
html>
head>
meta http-equiv="Content-Type" content="text/html; charset=utf-8">
meta name="viewport" content="initial-scale=1, maximum-scale=1,user-scalable=no">
title>Non graphic info windowtitle>
link rel="stylesheet" type="text/css" href="http://localhost/arcgis_js_api/library/3.3/jsapi/js/esri/css/esri.css" />
style>
html, body, #map{
height: 100%;
margin: 0;
padding: 0;
}
.esriPopup .titlePane
{
background-color: rgba(64,64,64,0.8);
}
.esriPopup .contentPane
{
background-color: rgba(64,64,64,0.8);
color: #FFFFFF;
}
.esriPopup .actionsPane
{
background-color: rgba(64,64,64,0.8);
}
style>
script type="text/Javascript" src="http://localhost/arcgis_js_api/library/3.3/jsapi/init.js">script>
script>
var map;
require([
"esri/map"
], function (
Map
) {
map = new esri.Map("map", {
basemap: "satellite",
center: [-116.96, 33.184],
zoom: 7
});
map.on("load", function () {
map.infoWindow.resize(250, 100);
});
map.on("click", addPoint);
function addPoint(evt) {
var latitude = evt.mapPoint.getLatitude();
var longitude = evt.mapPoint.getLongitude();
map.infoWindow.setTitle("Coordinates");
map.infoWindow.setContent(
‘
screen x/y : " + evt.screenPoint.x + ", " + evt.screenPoint.y+‘
   map = new esri.Map("map", {
                basemap: "satellite",
                center: [-116.96, 33.184],
                zoom: 7
            });
也可以替换为下面的形式:
map.addLayer(MyTiledMapServiceLayer);
文章标题:ArcGIS API for js InfoWindow
文章链接:http://soscw.com/essay/95384.html