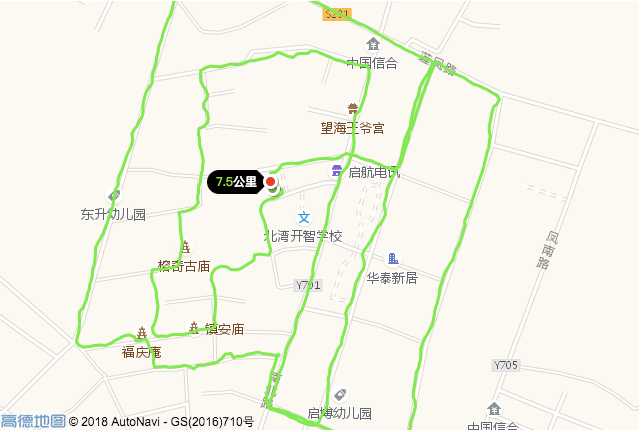
高德地图 API 显示跑步路线
2021-04-20 08:28
模仿对象
此前在尝试制作时,我采用 Nike+ 官网效果为模板仿制。目前 Nike+ 已经升级,看不了之前版本的样式及动态效果,暂且看看样式区别不大的 Nike+ Run Club App 地图,动画部分依然以此前 Nike+ 官网效果为准。
分析一下,想要仿制跑步路线图,其中有两个难点,第一个是画线动态效果,第二个是路线的渐变效果。画线动画是跑步过程的表现,渐变效果则是实时配速的表现。
光看都能感觉到渐变效果比较难,故这边就先不模仿它,搞定画线动画先。之前在 Nike+ 网页端,还在终点显示了跑步路程,画线动画进行的同时显示已跑的距离。
实现过程
网页端显示不比 App,尤其是还想嵌入在文章中的。一般是加载后,再给个点击事件激活动画效果。
添加折线
首先,把跑步折线显示出来,并显示起终点。在高德地图 API 文档中看到,可以使用 HTML 代码显示点标记的内容[1],这样一来,起终点以及距离都直接写 HTML,样式直接用 CSS 写就行。也方便后续画线动画时实时显示已跑的距离。
// 坐标集 var lineArr = [ [116.81333,23.48132], [116.81333,23.48132], [116.81333,23.48132], [116.81352,23.48133], [116.81353,23.48124], ... ]; // 坐标总数,起终点坐标 var count = lineArr.length; var first = lineArr[0]; var last = lineArr[count - 1]; // 构造地图对象 var map = new AMap.Map(‘map‘); // 跑步路线折线 var polyline = new AMap.Polyline({ map: map, path: lineArr, lineJoin: ‘round‘, strokeColor: "#52EE06", strokeOpacity: 1, strokeWeight: 3, strokeStyle: "solid" }); // 地图自适应 map.setFitView(); // 起点 new AMap.Marker({ map: map, position: first, zIndex: 11, offset: new AMap.Pixel(-8, -8), content: ‘‘ }); // 终点 new AMap.Marker({ map: map, position: last, zIndex: 11, offset: new AMap.Pixel(-8, -8), content: ‘‘ }); // 距离 var distance = new AMap.Marker({ map: map, position: last, zIndex: 10, offset: new AMap.Pixel(-64, -12), // 采用 Polyline 类的 getLength() 方法直接获取折线长度 content: ‘‘ + (polyline.getLength()/1000).toFixed(1) + ‘公里‘ });
到这里,CSS 稍微修饰一翻,便可正常显示出跑步的路线、起终点坐标以及跑步距离。
添加动画
接下来是复杂一点的画线动画,先分析动画需要显示的:
- 画线效果为不断加长的折线
- 有个实时移动的点标记,刚开始是不显示的
- 画线同时,跑步路线底层为透明效果的黑色折线
- 画线同时,跑步距离文字随着动画效果而变化
其中:
- 折线可利用高德地图 API Polyline 类的
setPath()方法来实现 - 点标记则是用
setPosition()方法 - 底层的透明折线则可将上面显示的折线直接拿过来用,方法为
setOptions() - 点标记的
setContent()方法
于是将画线效果封装成函数,采用 setTimeout() 方法做延时,为了看到的是效果流畅,将 delay 设置为 40(即 40 毫秒,每秒 25 帧),自增变量并循环执行。
// 变化的折线 var runPolyline = new AMap.Polyline({ map: map, lineJoin: ‘round‘, strokeColor: "#52EE06", strokeOpacity: 1, strokeWeight: 3, strokeStyle: "solid", }); // 移动的点标记 var current = new AMap.Marker({ map: map, zIndex: 12, visible: false, offset: new AMap.Pixel(-8, -8), content: ‘‘ }); // 点击地图事件 map.on(‘click‘, function() { // 将上面上面折线改为黑色透明作为底层 polyline.setOptions({ strokeColor: ‘#000000‘, strokeOpacity: 0.2 }); // 显示画线点标记 current.show(); i = 0; drawline(); }); // 画线动画 function drawline() { if ( i count ) { current.setPosition(lineArr[i]); runPolyline.setPath(lineArr.slice(0, i+1)); distance.setContent(‘‘ + (runPolyline.getLength()/1000).toFixed(1) + ‘公里‘); i++; } else { current.hide(); return; } setTimeout(drawline, 40) }
完善动画
Nike+ 的坐标约为十米一记,一个半马两千个点,若一下子循环执行这么多次,一些浏览器可能性能不保,会影响到具体显示的效果。在这里需要做优化,将每次画线增加的距离改为可控。
// 画线动画 function drawline(step) { if (i step) { var start = i * step; var end = (i + 1) * step >= count ? count - 1 : (i + 1) * step; current.setPosition(lineArr[end]); runPolyline.setPath(lineArr.slice(0, end+1)); distance.setContent(‘‘ + (runPolyline.getLength()/1000).toFixed(1) + ‘公里‘); i++; } else { current.hide(); return; } setTimeout(function(){ drawline(step); }, 40) }
这样一来,即 drawline(10) 则为一帧 100 米,一帧多少米也可根据点的数量指定,从而控制动画运行的总时间及保住某些浏览器。
最后给它一个 flag,将画线动画改为可暂停。
var running = false; var i = 0; // 点击地图事件 map.on(‘click‘, function() { // 将上面上面折线改为黑色透明作为底层 polyline.setOptions({ strokeColor: ‘#000000‘, strokeOpacity: 0.2 }); // 显示画线点标记 current.show(); running = running == false ? true : false; // 动画运行总时间约五秒 var step = parseInt(count/50); step = step == 0 ? 1 : step; drawline(step); }); // 画线动画 function drawline(step) { if ( i step ) { if( running == true ){ var start = i * step; var end = (i + 1) * step >= count ? count - 1 : (i + 1) * step; current.setPosition(lineArr[end]); runPolyline.setPath(lineArr.slice(0, end+1)); distance.setContent(‘‘ + (runPolyline.getLength()/1000).toFixed(1) + ‘公里‘); i++; } else { return; } } else{ current.hide(); i = 0; running = false; return; } setTimeout(function(){ drawline(step); }, 40) }
完整实例
加上 CSS,我将完整的实例扔在 GitHub[2],需要自取。

参考资料
- ^ Marker 类覆盖物
- ^ 高德地图 API 显示跑步路线