【算法实践进阶】任务2 特征工程
2021-06-09 21:03
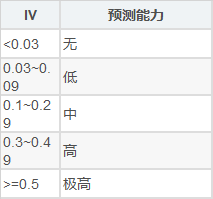
标签:金融 mod 阶段 rand node tps read bootstrap 方式 导入本次任务所用到的包: 准备数据 说明:这份数据集是金融数据(非原始数据,已经处理过了),我们要做的是预测贷款用户是否会逾期。表格中 “status” 是结果标签:0 表示未逾期,1 表示逾期。 本次导入的是前文(【一周算法实践进阶】任务 1 数据预处理)已经清洗过的数据集: 5 rows × 89 columns 将原始数据划分为数据集以及标签 标准化 5 rows × 88 columns IV 的全称是 Information Value,中文意思是信息价值,或者信息量。此处仅介绍IV值的计算方式,具体可以看参考资料。 首先计算WOE(Weight of Evidence)值:WOEi?=ln(p(ni?)/p(yi?)?)=ln(yi?/yT/ni?/nT???) 其中,p(yi)指本组逾期客户(即status=1)占样本中所有逾期客户的比例,p(ni)指本组未逾期客户(即status=0)占样本中所有未逾期客户的比例。yi是本组逾期客户的数量,yT是所有样本逾期客户的数量,ni是本组未逾期客户的数量,nT是所有样本未逾期客户的数量。 根据特征的IV值,可以得到特征的预测能力,如下表。 数据分箱 初始化阶段 合并阶段 (2)将卡方值最小的相邻组合并 (chiMerge函数代码来自参考资料3,有修改) 计算所有特征的iv值 降序输出: n_estimators: 也就是弱学习器的最大迭代次数,或者说最大的弱学习器的个数。 对参数n_estimators粗调: 对参数n_estimators细调: 将IV值和随机森林的特征重要度进行整合: 【算法实践进阶】任务2 特征工程 标签:金融 mod 阶段 rand node tps read bootstrap 方式 原文地址:https://www.cnblogs.com/HondaHsu/p/14487707.html

import pandas as pd
import numpy as np
from scipy import stats
import matplotlib.pyplot as plt
from sklearn.model_selection import train_test_split, GridSearchCV
from sklearn.linear_model import LogisticRegression
from sklearn.tree import DecisionTreeClassifier
from sklearn.svm import SVC
from sklearn.metrics import accuracy_score, precision_score, recall_score,                            confusion_matrix, f1_score, roc_curve, roc_auc_score
from sklearn.ensemble import RandomForestClassifier, GradientBoostingClassifier
from lightgbm import LGBMClassifier
from xgboost import XGBClassifier
from sklearn.preprocessing import StandardScaler
import warnings

warnings.filterwarnings(module=‘sklearn*‘, action=‘ignore‘, category=DeprecationWarning)
%matplotlib inline
plt.rc(‘font‘, family=‘SimHei‘, size=14)
plt.rcParams[‘axes.unicode_minus‘]=False
%config InlineBackend.figure_format = ‘retina‘
导入数据
原始数据集下载地址: https://pan.baidu.com/s/1wO9qJRjnrm8uhaSP67K0lw

data_processed = pd.read_csv(‘data_processed.csv‘)
data_processed.head()

划分数据
label = data_processed[‘status‘]
data = data_processed.drop([‘status‘], axis=1)
scaler = StandardScaler()
data_scaled = pd.DataFrame(scaler.fit_transform(data), columns=data.columns)
data_scaled.head()

特征选择
根据IV值

得到IV的计算公式:

在计算IV值之前,首先要对数据进行进行分箱操作,分箱包含有监督分箱(卡方、最小熵法)和无监督分箱(等距、等频、聚类)。我们采用卡方分箱,其他分箱方法的介绍见参考资料。
首先按照属性值对实例进行排序,每个实例属于一个分组。
(1)计算每一对相邻组的卡方值


def chiMerge(df, col, target, threshold=None):
    ‘‘‘ 卡方分箱
    df: pandas dataframe数据集
    col: 需要分箱的变量名(数值型)
    target: 类标签
    max_groups: 最大分组数。
    threshold: 卡方阈值,如果未指定max_groups,默认使用置信度95%设置threshold。
    return: 包括各组的起始值的列表.
    ‘‘‘
    freq_tab = pd.crosstab(df[col],df[target])
    freq = freq_tab.values #转成 numpy 数组用于计算。
    # 1.初始化阶段:按照属性值对实例进行排序,每个实例属于一个分组。
    # 为了保证后续分组包含所有样本值,添加上一个比最大值大的数
    cutoffs = np.append(freq_tab.index.values, max(freq_tab.index.values)+1)
    if threshold == None:
        # 如果没有指定卡方阈值和最大分类数
        # 则以 95% 的置信度(自由度为类数目 - 1)设定阈值。
        cls_num = freq.shape[-1]
        threshold = stats.chi2.isf(0.05, df=cls_num - 1)
    # 2.合并阶段
    while True:
        minvalue = np.inf
        minidx = np.inf
        # 计算每一对相邻组的卡方值
        for i in range(len(freq) - 1):
            v = stats.chi2_contingency(freq[i:i+2] + 1, correction=False)[0]
            # 更新最小值
            if minvalue > v:
                minvalue = v
                minidx = i
        # 如果最小卡方值小于阈值,则合并最小卡方值的相邻两组,并继续循环
        if threshold != None and minvalue  threshold:
            freq[minidx] += freq[minidx+1]
            freq = np.delete(freq, minidx+1, 0)
            cutoffs = np.delete(cutoffs, minidx+1, 0)
        else:
            break

    return cutoffs
IV值计算


def iv_value(df, col, target):
    ‘‘‘ 计算单列特征的IV值
    df: pandas dataframe数据集
    col: 需要计算的变量名(数值型)
    target: 标签
    return: 该特征的iv值
    ‘‘‘
    bins = chiMerge(df, col, target) # 获得分组区间
    cats = pd.cut(df[col], bins, right=False)
    # 为了防止除0错误,对分子分母均做+1处理
    temp = (pd.crosstab(cats, df[target]) + 1) / (df[target].value_counts() + 1)
    woe = np.log(temp.iloc[:, 1] / temp.iloc[:, 0])
    iv = sum((temp.iloc[:, 1] - temp.iloc[:, 0]) * woe)

    return iv


iv = []
data_iv = pd.concat([data_scaled, label], axis=1)

for col in data_scaled.columns:
    iv.append(iv_value(data_iv, col, ‘status‘))
iv = np.array(iv)
np.save(‘iv‘, iv)
iv = np.load(‘iv.npy‘)
iv


array([0.02968667, 0.06475457, 0.06981247, 0.27089581, 0.03955683,
       0.13346826, 0.00854632, 0.03929596, 0.04422897, 0.00559611,
       0.53421682, 0.        , 0.03166467, 0.38242452, 0.92400898,
       0.18871897, 0.11657733, 0.79563374, 0.        , 0.36688692,
       0.06479698, 0.08637859, 0.0315798 , 0.08726314, 0.02813494,
       0.07862981, 0.02872391, 0.00936212, 0.59139039, 0.25168984,
       0.25886425, 0.42645628, 0.32054195, 0.01342581, 0.00419829,
       0.23346355, 0.57449389, 0.        , 0.37383946, 0.14084117,
       0.50192192, 0.01717901, 0.        , 0.00990202, 0.02356634,
       0.02668144, 0.03360329, 0.02932465, 0.00517526, 0.66353628,
       0.        , 0.05768091, 0.03631875, 0.40640499, 0.01445641,
       0.00671275, 0.01300546, 0.00552671, 0.03980268, 0.03645762,
       0.0140021 , 0.65682529, 0.15289713, 0.37204304, 0.05508829,
       0.0192688 , 0.01318021, 0.01300546, 0.01037065, 0.01728017,
       0.25268217, 0.15254589, 0.00475146, 0.00671275, 0.01011964,
       0.03126195, 0.50228468, 0.11432889, 0.07337619, 0.        ,
       0.        , 0.        , 0.        , 0.        , 0.03444958,
       0.00903816, 0.01497038, 0.        ])
随机森林
param = {‘n_estimators‘: list(range(10, 1001, 50))}
g = GridSearchCV(estimator = RandomForestClassifier(random_state=2018),
                       param_grid=param, cv=5)
g.fit(data_scaled, label)
g.best_estimator_


RandomForestClassifier(bootstrap=True, class_weight=None, criterion=‘gini‘,
            max_depth=None, max_features=‘auto‘, max_leaf_nodes=None,
            min_impurity_decrease=0.0, min_impurity_split=None,
            min_samples_leaf=1, min_samples_split=2,
            min_weight_fraction_leaf=0.0, n_estimators=810, n_jobs=1,
            oob_score=False, random_state=2018, verbose=0,
            warm_start=False)


param = {‘n_estimators‘: list(range(770, 870, 10))}
forest_grid = GridSearchCV(estimator = RandomForestClassifier(random_state=2018),
                       param_grid=param, cv=5)
forest_grid.fit(data, label)
rnd_clf = forest_grid.best_estimator_
rnd_clf


RandomForestClassifier(bootstrap=True, class_weight=None, criterion=‘gini‘,
            max_depth=None, max_features=‘auto‘, max_leaf_nodes=None,
            min_impurity_decrease=0.0, min_impurity_split=None,
            min_samples_leaf=1, min_samples_split=2,
            min_weight_fraction_leaf=0.0, n_estimators=810, n_jobs=1,
            oob_score=False, random_state=2018, verbose=0,
            warm_start=False)
综合分析