CPU 问题 —— 数据收集(官网)-- Debug high CPU usage in .NET Core
2021-03-03 08:26
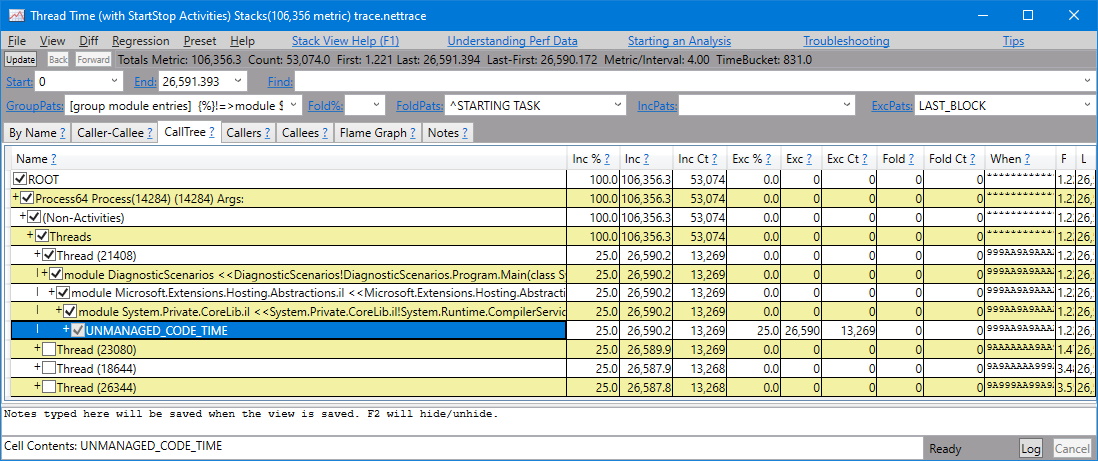
标签:sites hover complete sage timers processes pool with cti Debug high CPU usage in .NET Core In this tutorial, you‘ll learn how to debug an excessive CPU usage scenario. Using the provided example ASP.NET Core web app source code repository, you can cause a deadlock intentionally. The endpoint will experience a hang and thread accumulation. You‘ll learn how you can use various tools to diagnose this scenario with several key pieces of diagnostics data. In this tutorial, you will: The tutorial uses: Before attempting to collect diagnostics data, you need to observe a high CPU condition. Run the sample application using the following command from the project root directory. To find the process ID, use the following command: Take note of the process ID from your command output. Our process ID was The With the web app running, immediately after startup, the CPU isn‘t being consumed at all and is reported at Now, rerun the dotnet-counters command. To monitor just the You should see an increase in CPU usage as shown below: Throughout the duration of the request, the CPU usage will hover around 25% . Depending on the host machine, expect varying CPU usage. Tip To visualize an even higher CPU usage, you can exercise this endpoint in multiple browser tabs simultaneously. At this point, you can safely say the CPU is running higher than you expect. When analyzing a slow request, you need a diagnostics tool that can provide insights into what the code is doing. The usual choice is a profiler, and there are different profiler options to choose from. On Windows, you can use the dotnet-trace tool as a profiler. Using the previous sample debug target, exercise the high CPU endpoint ( Let dotnet-trace run for about 20-30 seconds, and then press the Enter to exit the collection. The result is a Open the CPU 问题 —— 数据收集(官网)-- Debug high CPU usage in .NET Core 标签:sites hover complete sage timers processes pool with cti 原文地址:https://www.cnblogs.com/panpanwelcome/p/14276570.html
Prerequisites
CPU counters
dotnet run
dotnet-trace ps
22884, but yours will be different. To check the current CPU usage, use the dotnet-counters tool command:dotnet-counters monitor --refresh-interval 1 -p 22884
refresh-interval is the number of seconds between the counter polling CPU values. The output should be similar to the following:Press p to pause, r to resume, q to quit.
Status: Running
[System.Runtime]
% Time in GC since last GC (%) 0
Allocation Rate / 1 sec (B) 0
CPU Usage (%) 0
Exception Count / 1 sec 0
GC Heap Size (MB) 4
Gen 0 GC Count / 60 sec 0
Gen 0 Size (B) 0
Gen 1 GC Count / 60 sec 0
Gen 1 Size (B) 0
Gen 2 GC Count / 60 sec 0
Gen 2 Size (B) 0
LOH Size (B) 0
Monitor Lock Contention Count / 1 sec 0
Number of Active Timers 1
Number of Assemblies Loaded 140
ThreadPool Completed Work Item Count / 1 sec 3
ThreadPool Queue Length 0
ThreadPool Thread Count 7
Working Set (MB) 63
0%. Navigate to the api/diagscenario/highcpu route with 60000 as the route parameter:https://localhost:5001/api/diagscenario/highcpu/60000cpu-usage, specify System.Runtime[cpu-usage] as part of the command.dotnet-counters monitor --counters System.Runtime[cpu-usage] -p 22884 --refresh-interval 1
Press p to pause, r to resume, q to quit.
    Status: Running

[System.Runtime]
    CPU Usage (%)                                         25
Trace generation
https://localhost:5001/api/diagscenario/highcpu/60000) again. While it‘s running within the 1-minute request, use the collect command as follows:dotnet-trace collect -p 22884 --providers Microsoft-DotNETCore-SampleProfiler
nettrace file located in the same folder. The nettrace files are a great way to use existing analysis tools on Windows.nettrace with PerfView as shown below.
文章标题:CPU 问题 —— 数据收集(官网)-- Debug high CPU usage in .NET Core
文章链接:http://soscw.com/essay/59426.html