Rapidly detecting large flows, sFlow vs. NetFlow/IPFIX
2020-12-13 03:05
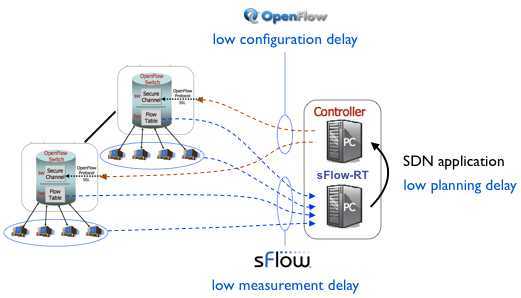
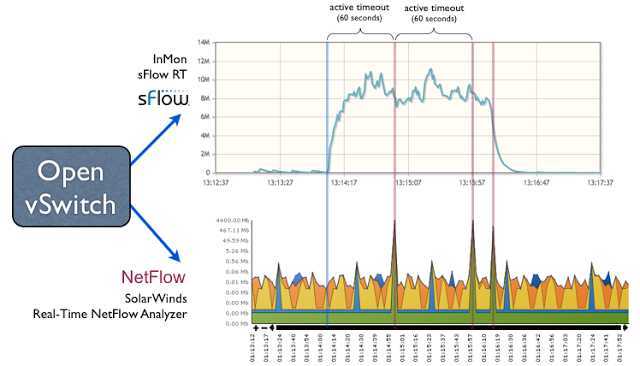
标签:des style blog code http tar Figure 1: Low latency software defined networking control loop The articles SDN and delay and Delay and stability describe the critical importance of low measurement delay in constructing stable and effective controls. This article will examine the difference in measurement latency between sFlow and NetFlow/IPFIX and their relative suitability for driving control decisions. Figure 2: sFlow and NetFlow agent architectures Figure 2 illustrates shows the architectural differences between the sFlow and IPFIX/NetFlow instrumentation in a switch: Figure 3: Latency of large flow detection using sFlow and NetFlow The charts in Figure 3 show how each technology reports on a large data transfer. The charts have been aligned to have the same time axis so you can easily compare them. The vertical blue line indicates the start of the data transfer. Rapidly detecting large flows, sFlow vs. NetFlow/IPFIX,搜素材,soscw.com Rapidly detecting large flows, sFlow vs. NetFlow/IPFIX 标签:des style blog code http tar 原文地址:http://www.cnblogs.com/forfuture1978/p/3793062.html

The flow cache introduces significant measurement delay for NetFlow/IPFIX based monitoring since the measurements are only accessible to management applications once they are flushed from the cache and sent to a traffic analyzer. In contrast, sFlow has no cache - measurement are immediately sent and can be quickly acted upon, resulting in extremely low measurement delay.
Open vSwitch is a useful testbed for demonstrating the impact of the flow cache on measurement delay since it can simultaneously export both NetFlow and sFlow, allowing a side-by-side comparison. The article, Comparing sFlow and NetFlow in a vSwitch, describes how to configure sFlow and NetFlow on the Open vSwitch and demonstrates some of the differences between the two measurement technologies. However, this article focusses on the specific issue of measurement delay.
Figure 3 shows the experimental setup, with sFlow directed to InMon sFlow-RT and NetFlow directed to SolarWinds Real-Time NetFlow Analyzer.
Note: Both tools are available at no charge, making it easy for anyone to reproduce these results. 
Note: A one minute active timeout is the lowest configurable value on many Cisco switches (the default is 30 minutes), see Configuring NetFlow and NetFlow Data Export.
The large measurement delay imposed by the NetFlow/IPFIX flow cache makes the technology unsuitable for SDN control applications. The measurement delay can lead to instability since the controller is never sure of the current traffic levels and may be taking action based on stale data reported for flows that are no longer active.
In contrast, the sFlow measurement system quickly detects and continuously tracks large flows, allowing an SDN traffic management application to reconfigure switches and balance the paths that active flows take across the network.
文章标题:Rapidly detecting large flows, sFlow vs. NetFlow/IPFIX
文章链接:http://soscw.com/essay/26884.html